Abstract
Each precipitation event has a unique fingerprint. This fingerprint is recorded in the duration of the event and the isotopic composition of the rainfall, as a result of differing proportions of oxygen isotopes. The ratio of O16 to O18 is crucial in identifying the origin and movement of water within the hydrologic cycle. In some investigated watersheds, as rainwater flows through the ecosystem, it is continually recorded by a series of in-ground instruments and examined as a means of understanding the responsiveness of the hydrologic system of a particular region. Sonification of these unique fingerprints as each storm passes through the hydrologic system offers an opportunity to represent fluctuations in rainwater hydrology over an extended period of time, allowing for a deeper understanding of the region's hydrologic cycle. Transformation of the data into sound creates a uniquely informative representation removed from the constraints of static visualizations such as the line graph, and — if the datasets span long durations — can provide a distinctive perspective on both individual weather events and larger climate patterns within a particular geographical region.
Introduction
This project introduces techniques for exploring a large hydrologic database through the process of data sonification. The sonification of hydrologic data allows the listener to explore multiple variables comprising the hydrologic dynamics of a region over an extended period of time. The present sonification tracks variables pertaining to isotopic data — including groundwater, stream water, and precipitation — over a period of three years.
Critical Zone Observatories
Critical Zone Observatories (CZOs) are natural laboratories for investigating Earth's surface processes by monitoring streams, climate, and groundwater. Each CZO is instrumented for hydrogeochemical measurements of soil, canopy, and bedrock data. The U.S. CZO network grew to nine observatories in 2013, with additional CZOs developing worldwide. The CZO program is a collaborative effort to advance scientific understanding of multi-scale environmental interactions in the critical zone, from bedrock to the atmospheric boundary layer. Analysis of isotopic rainwater hydrology data at these observatories is crucial to understanding the hydrological health of each CZO-represented region throughout the United States.
Isotope Hydrology
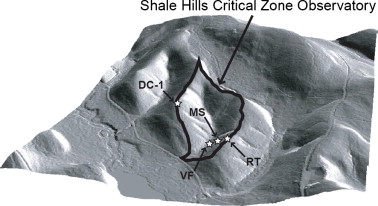
Water molecules carry characteristic isotopic fingerprints that allow researchers to identify the origins and movements of water through the hydrologic cycle. These molecules are composed of two oxygen isotopes: oxygen-16 (O16) and oxygen-18 (O18). O16, the lighter of the two, evaporates at a faster rate. As a result, water that has been exposed to evaporation for a longer period of time contains a greater relative quantity of O18. The ratio of O16 to O18 provides scientific information about the dynamics of hydrologic flow throughout a given region, as well as information about the provenance of water during storm events. Instruments in place at the Susquehanna Shale Hills Critical Zone Observatory in central Pennsylvania collect continuous hydrologic data to build a representation of the region's hydrologic health.
Sonification Procedures
The sonification was created using SuperCollider, an environment and programming language for real-time audio synthesis and algorithmic composition. Data collected by hydrologists were stored in tables and streamed through instruments designed in the SuperCollider language to represent each variable.
For groundwater, the variables were represented by the sound of dripping water. The droplet rate, variation, pitch, loudness, and stereo panning location were determined by the ratio of O16 to O18 in the groundwater data. As the ratio increases, the rate, sound variation, pitch, and amplitude increase, and the panning location shifts outward toward the listener's periphery.
Similarly, the stream water data were represented by a variation of the "babbling brook" SuperCollider synthesis, where the O16/O18 ratio controls the pitch, airiness, amplitude, and stereo panning location.
Precipitation was represented by designed storm sounds, including rain and thunder. The O16/O18 ratio controls the triggering of thunder (fired when the ratio reaches an adjustable positive threshold), the duration of the thunder, the perceived distance and amplitude of rain and thunder, the graininess of the rain, and the stereo pan location.
Creating multiple sonic characteristics for each variable provides a wider range of auditory feedback than a simpler one-to-one pairing of sound to data.
Instruments
The instruments created in SuperCollider were designed for flexible representation of dynamic data. By using multiple sonic parameters to represent a single data variable, the sonification allows the listener to intuitively perceive dynamic fluctuations within the data without needing to focus on any single parameter. Variables including the amount of Brownian motion, resonant high-pass filter frequency, low-pass filter frequency, pitch, bandwidth, pan, and amplitude are each normalized between reasonable bounds in relation to the O16/O18 ratio. The data are then run through a Task that iterates through each data point and generates corresponding sound. The playback speed can be adjusted: faster speeds reveal general trends, while slower speeds permit point-by-point analysis.
(
SynthDef(\groundwater, {| gate=1, amp=40, pan=0, mul=0.005, rq=0.03, pitch1=500, pitch2=800, lpf1=14, lpf2=30, noise1=1, noise2=1, bubble1=1, bubble2=1, delay=0.002|
    var src, src2, out, env;
    env=EnvGen.kr(Env.asr(0.01, 1), gate, doneAction:2);
    src=OneZero.ar(Impulse.ar(noise1), 0.99);
    src=RHPF.ar(src, LPF.ar(BrownNoise.ar(bubble1), lpf1)*600 + pitch1, rq, mul);
    src2=OneZero.ar(Impulse.ar(noise2), 0.99);
    src2=DelayL.ar(RHPF.ar(src2, LPF.ar(BrownNoise.ar(bubble2), lpf2)*600 + pitch2, rq, mul), 0.2, delay);
    out=Mix.ar([src, src2]);
    out=GVerb.ar(out, 20, 3, drylevel:0.01);
    out=Pan2.ar(src+src2, pan);
    Out.ar(0, out*env*amp*~masteramp)
}).add;
)
Summary
By comparing the sonic data between years and listening for indicators that identify seasonal changes, outliers within the dataset, and fluctuation patterns, geoscience researchers found the sonifications useful in providing an alternative representation of these large datasets.
References
- Brantley, S.L., White, T.S., Anderson, S.P., Bales, R.C., Chorover, J., McDowell, W.H. (2013): Critical Zone Science and Observatories. Abstract TH15D-01 presented at 2013 Fall Meeting, AGU, San Francisco, CA, 9–13 Dec.
- Whitenack, T., Williams, M.W., Tarboton, D.G., Zaslavsky, I., et al. (2010): Development of an integrated information system for Critical Zone Observatory data. Fall Meeting, American Geophysical Union, December 2010. Abstract IN31B-1289.
- McGuire, K. and McDonnell, J. (2008): Stable Isotope Tracers in Watershed Hydrology, in Stable Isotopes in Ecology and Environmental Science, Second Edition.
- Wilson, Scott, Nick Collins, and David Cottle. The SuperCollider Book. Cambridge, MA: MIT Press, 2011.